Rationale
Like many people at the moment, I am trying to get a feel for when to get back into the market. The last real comparable situation was the 1918 Spanish Flue (H1-N1 virus) [1], but this time it seems different.
I am currently at home, on lock-down in France and recently read a Bloomberg article by Simon Flint entitled; – “Five ‘Ps’ That Will Help Determine If the Market Has Bottomed” [2]. The article made me think about constructing a simple measure for those holding cash, based on easily accessible, publicly available data, as a tool to help time re-entry into the market.
Quantitatively, there are many ways to model and measure the temperature of the market. This is however a novel shock event and therefore backtesting a model is not really an option. Instead I have used some standard risk/fear measures, but also incorporated elements specific to the Covid-19 outbreak and also tailored it to try and reflect some of the ancillary topics that the market is currently focused on, such as the oil price.
The initial result of this, is a measure I call the Covid Market Fear Index, or CMF Index. It is made up of eight equally weighted components, which are simply averaged. The higher the number, “the greater the market fear”. The current value is around 58.1 (as of the 3rd April 2020). Below is a graph showing the index and its various components over time, since the start of February 2020.

I plan to update the CMF regularly for my own proprietary use.
If you would like to receive updates, you can contact me either via LinkedIn, email or via WhatsApp. Below is a description of the current CMF Index methodology;
Each of the eight factor has been transformed to be approximately in the range to 0 to 100, being winsorized to 100 on the right tail . The variables were selected to reflect some of the main factors that the market appears to be focusing on at the moment, however this list is by no means exhaustive!
CMF = 50 x log(Max[Covid new deaths, 100]) – 100 + 40 x log(Covid new cases/1000) + (VIX price-17) – (100 x mean[S&P 500 & WTI drawdown]) + Min[ (Initial claims – 200,000)/10,000, 100] + (50 x (0.7 + ANFCI) + (50 – median[PMI]) +Google trend Interest
Below is an explanation of each of the factors and the transformations applied
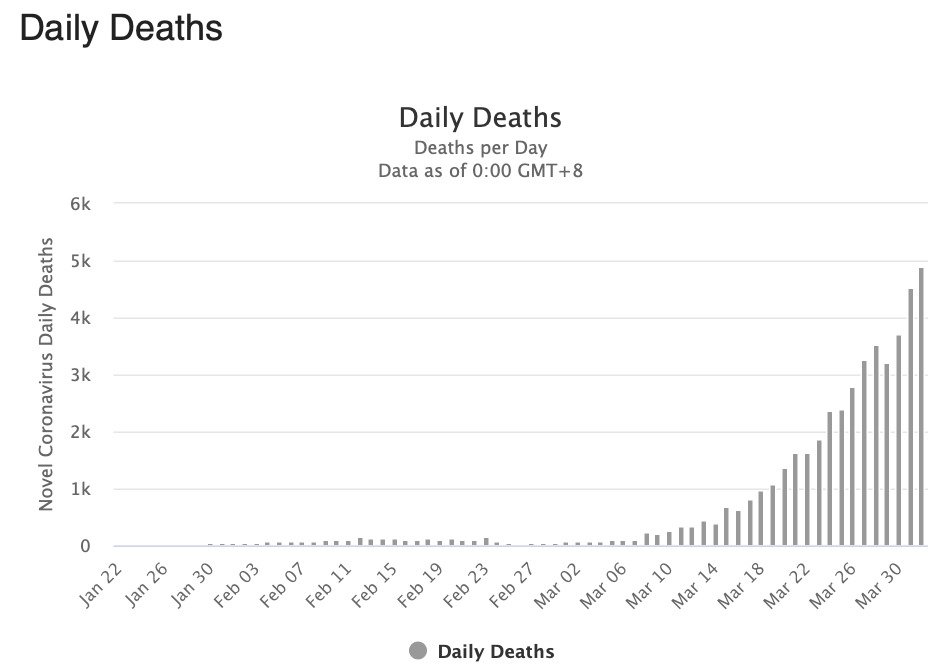
1. & 2. Medical: New daily COVID-19 deaths & new cases
For the number of new daily reported deaths the values arebcollated in a spreadsheet [3], and transformed by taking logs and scaling. Depending on the time of day, there is generally a one day lag in the number.

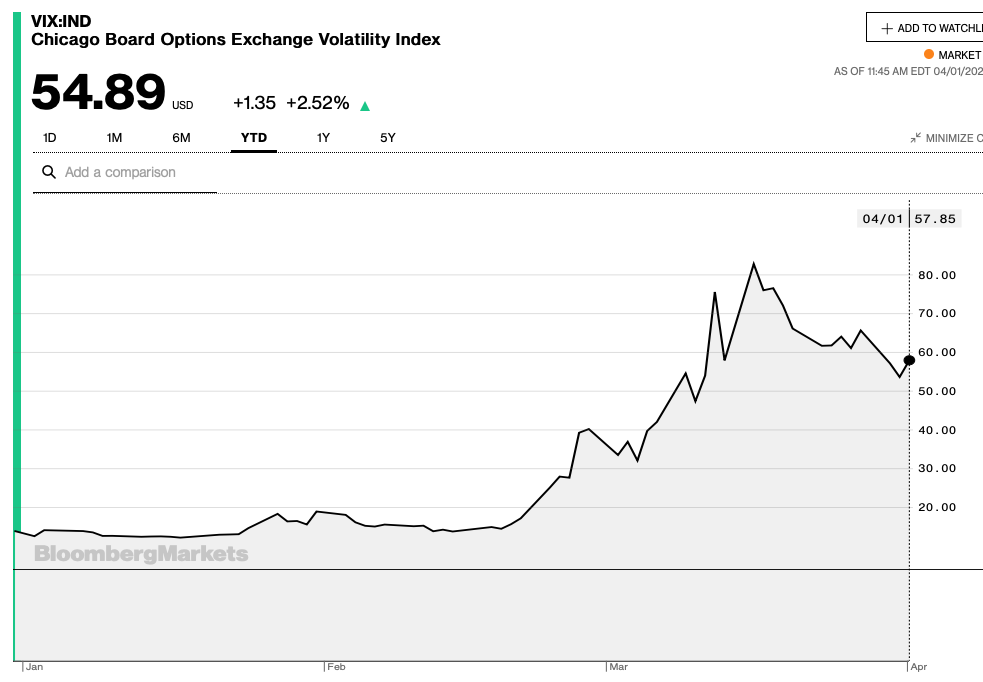
3. Risk: The VIX
The Implied Vol of the S&P 500 is a well know fear measure [4]. The subtraction of 17 is used, as it is roughly the long term median value. Note the VIX also forms a small component of the Chicago ANFCI.
Possible improvements? It might be worth exploring changes in the Vix, other implied vol or variance measures
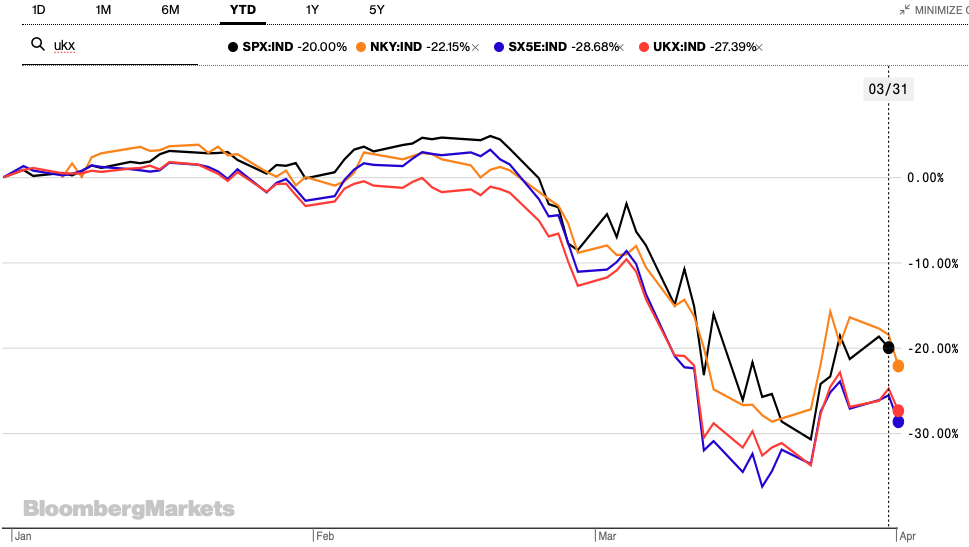
4. Market: S&P 500 & WTI Drawdown
I take an equal blend of the S&P 500 Index & WTI Crude future drawdowns. The drawdown for the S&P 500 is from a max of 3393.52 and for WTI the max is $53.78. Both are multiplied by x100 with the sign reversed and then averaged. Note, during pre US open, I adjust the spot price by the current one day front month S&P Future’s return, to approximate the out of opening hours value of the index.
Possible improvements? It maybe worth incorporating the tail risk of other risk assets.
5. Macro: Initial Claims (IC)
Initial Claims, shocked the market last Thursday, so It seems sensible to try and capture this effect [5]. The rather convoluted formula, is simply to rescale the IC change.
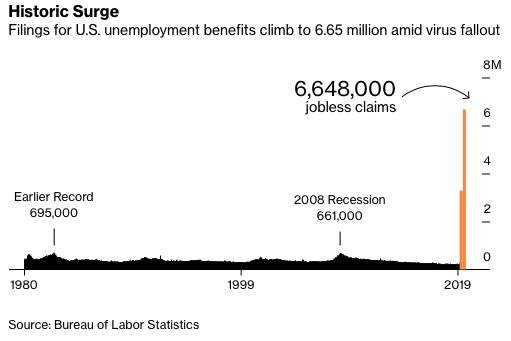
Min[ (Initial claims – 200,000)/10,000, 100]
Possible improvements? IC is just one of many short term macro/economic indicators
6. Economic: ANFCI
The Adjusted National Financial Conditions Index (AFNC)I is a weekly indictor published by the Federal Reserve Bank of Chicago [6]. Positive numbers tend to suggest market tightening in which case the market may underperform, while negative values imply loosening and possible inflation risk.
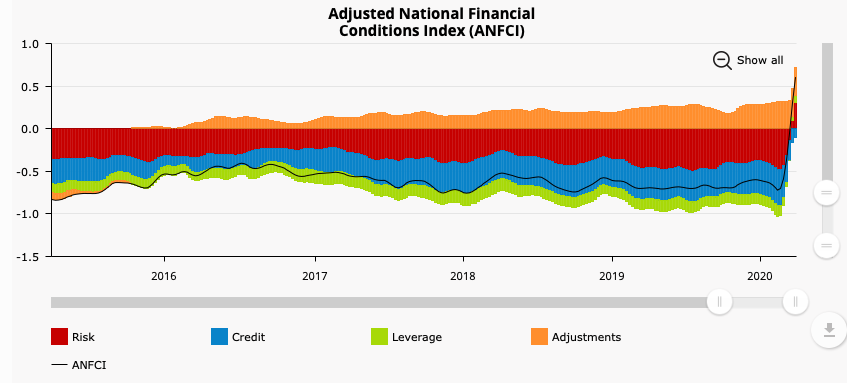
A full list of the indictors used can be found at: https://www.chicagofed.org/~/media/publications/nfci/nfci-indicators-list-pdf.pdf.
7. Business Sentiment: PMI
I take the median of the Purchasing Managers’ Index™ (PMI) across a number of regions and countries [7].
| Canada | Eurozone | ASEAN | Japan | UK | US |
Wherever possible I use the latest Flash Composite numbers as they are reported, however in the case of Canada and ASEAN, manufacturing numbers are used.
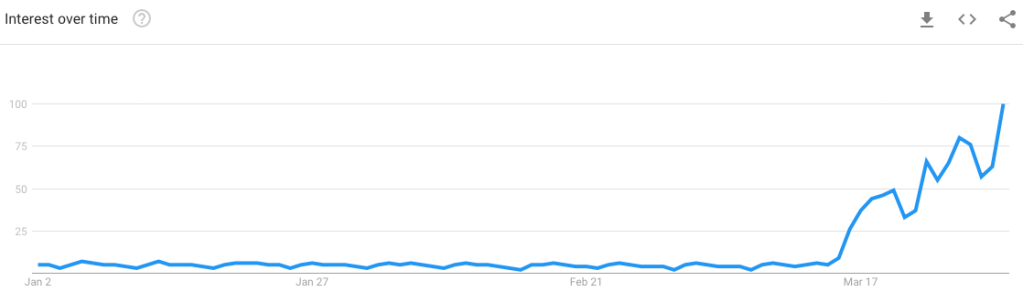
8 Crowd Sentiment: Google trends
There has been a lot of interest in recent years in the use of sentiment data as an alternative orthogonal data set, to more traditional price based, fundamental and macro data. A number of approaches can be used to capture sentiment, from google trend searches [8], to twitter feed data and more sophisticated approaches, such as using NLP and machine learning to parse a large corpus of text from news feeds or research reports.
For now, I just use the average of the global daily popularity of the search of the following 5 terms [9]
| recession | unemployment | Gold price | Credit default swaps | pandemic |
Disclaimer
The material in this post is purely for educational purposes and in no way constitutes investment advice. I may hold positions in any assets mentioned in this post. Furthermore, I am not responsible for any material that is found at the end of links that may be in this text.
References
[4] CBOE Volatility Index, Yahoo, https://finance.yahoo.com/quote/%5EVIX/
[5] FRED Economic Data, Initial Claims (ICSA), https://fred.stlouisfed.org/series/ICSA
[6] Brave, S, 2011, National Financial Conditions Index (NFCI), YouTube: Federal Reserve Bank of Chicago
[9] Google Trends, https://trends.google.com/trends/explore?date=today%203-m&q=oil%20price


